ECG PROCEDURE
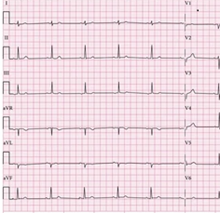
An ECG (electrocardiogram) is a graph picture of the electrical conduction of the heart. By examining the ECG, clinicians can identify various types of heart problems. It is performed with the help of electric leads (sensors), placed on specific locations on the chest and limbs.
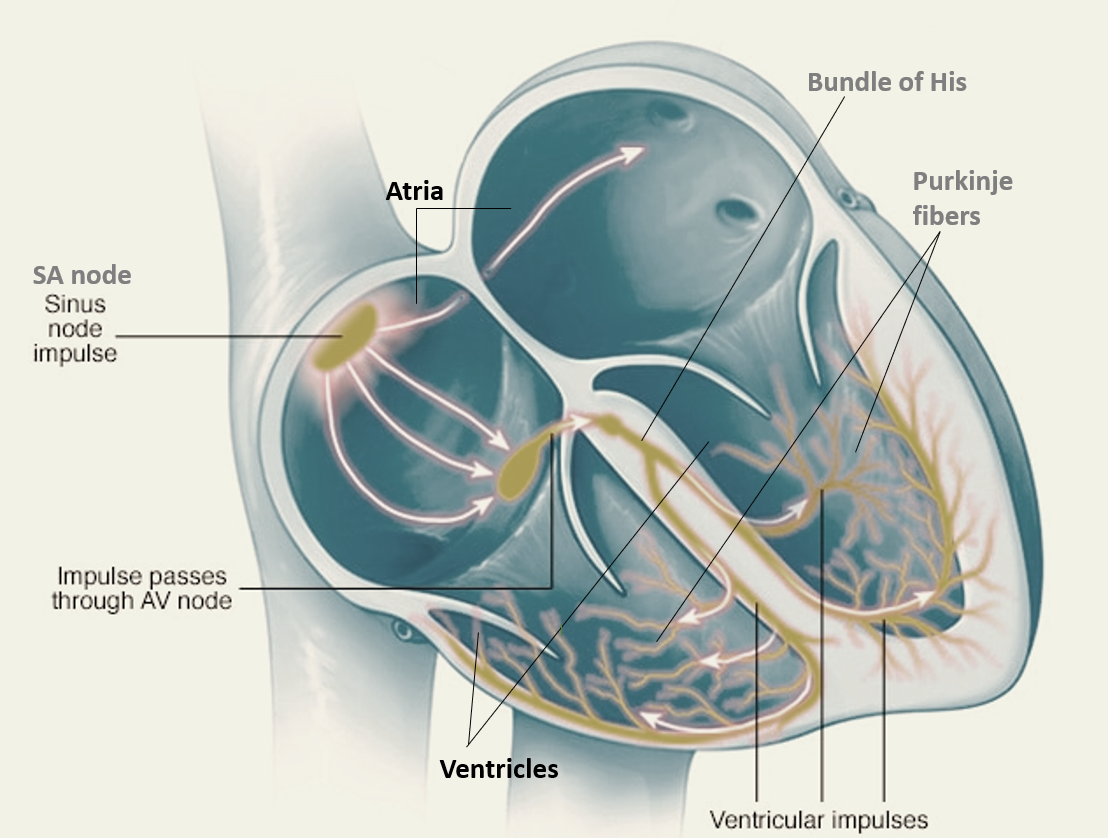
The electric conduction of the heart begins at the SA node from where it goes to the important AV node junction from where it spreads across the ventricles through the Bundle of His and Purkinje fibers.


Leads
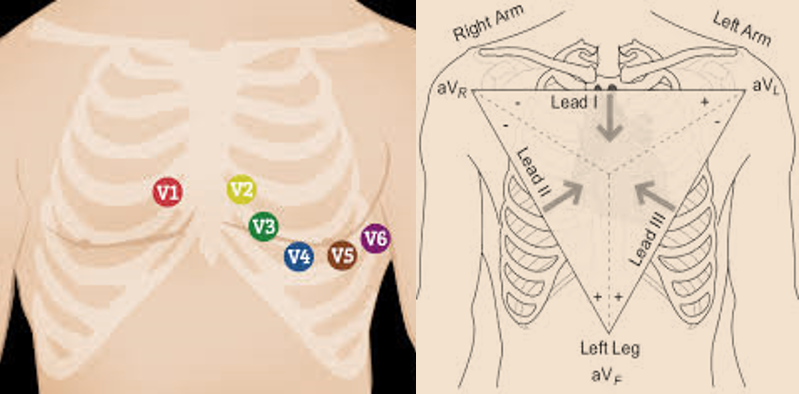
The standard ECG has 12 leads.
Six leads (V1, V2, V3, V4, V5, and V6) are precordial leads placed on the chest.
Six of the leads are limb leads (I, II, III, aVL, aVR, and aVF), placed on the arms and legs of the individual. The letter “a” stands for “augmented,” as these leads are calculated as a combination of leads I, II, and III.
Lead II, aVF, and III are called inferior limb leads because they primarily observe the inferior (lower) wall of the left ventricle.
Lead aVL, I, and –aVR are called lateral limb leads because they primarily observe the lateral (side) wall of the left ventricle.
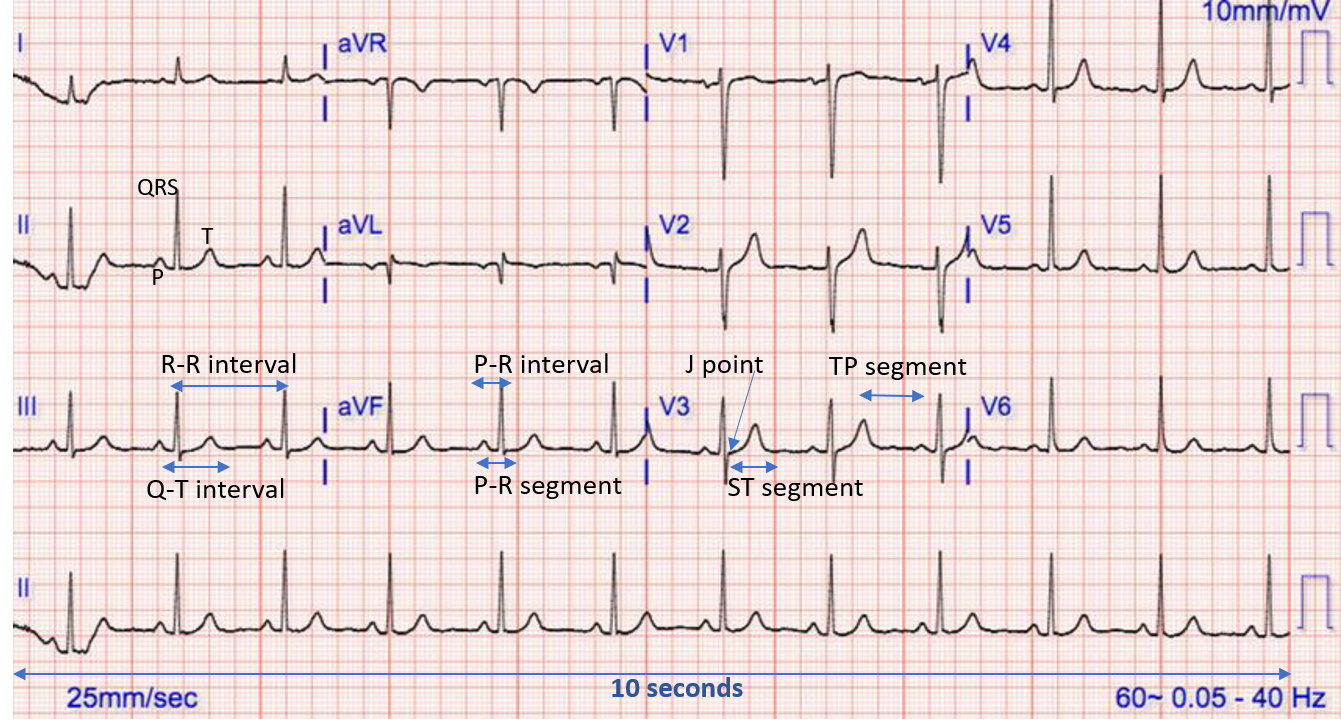
Before starting the ECG, one should ascertain that the name and date of birth of the patient match with the details on the ECG, the date and time of the ECG are recorded, and the calibration of the ECG is 25mm/s and 10mm/1mV.
The ECG captures the heart’s electrical activity from various leads on a graph paper strip.


PARTS OF ECG
Waves
Wave are positive or negative deflections from baseline that indicate a specific electrical event. The P wave indicates atrial depolarization.
The QRS complex consists of a Q wave, R wave, and S wave together and represents ventricular depolarization. Small QRS complexes are defined as < 5mm in the limb leads or < 10 mm in the chest leads, while tall complexes imply ventricular hypertrophy (or just due to body habitus like tall slim people).
The T wave comes after the QRS complex and indicates ventricular repolarization.
(Note: The movement of a cell’s membrane potential to a more positive value is referred to as depolarization, while the change in membrane potential from a positive to a negative value is referred to as repolarization.)
Intervals and Segments
Intervals are the time between two specific ECG events. The intervals commonly measured on an ECG include the PR, QRS, QT interval, and RR interval. Out of these, the PR interval has the maximum significance. The PR interval should be between 120-200 ms (3-5 small squares).
Segments are the lengths between two specific points on an ECG that are supposed to be at the baseline amplitude (not negative or positive). These are PR, ST, and TP segments. The J point is where the QRS complex ends and the ST segment begins.


CLINICAL INTERPRETATION OF ECG
HEART RATE (HR)
- Normal: 60-100 bpm
- Tachycardia: > 100 bpm
- Bradycardia: < 60 bpm
For regular heart rhythm, the heart rate can be calculated by counting the number of large squares present within one R-R interval, and divide 300 by this number. For example, if there are 4 large squares in an R-R interval, then HR= 300/4 = 75 beats per minute (bpm)
For Irregular heart rhythm, the R-R interval differs significantly throughout the ECG, so a different method is needed which is counting the number of complexes on the rhythm strip (each rhythm strip is typically 10 seconds long) and multiplying the number of complexes by 6 (giving you the average number of complexes in 1 minute). For example, if there are 12 complexes on a rhythm strip, HR = 12 x 6 = 72 beats per minute
HEART RHYTHM
A patient’s heart rhythm can be regular or irregular. The R-R intervals are studied to assess if the rhythm is regular or irregular.
Irregular rhythms can be either:
- Regularly irregular (recurrent pattern of irregularity)
- Irregularly irregular (completely disorganized)
One marks out several consecutive R-R intervals on a piece of paper and moves them along the rhythm strip to check if the subsequent intervals are similar.
Heart rhythm problems are called cardiac arrhythmias. They occur when the electrical impulses that coordinate our heartbeats don’t work properly, causing the heart to beat either too fast (tachycardia), or too slow (bradycardia), or sometimes irregularly.
If one suspects atrioventricular block (AV block), the atrial rate and the ventricular rhythm is assessed separately (by marking the P waves and R waves). As one moves along the rhythm strip, one can see if the PR interval changes, if QRS complexes are missing, or if there is complete dissociation between the two.
CARDIAC AXIS
The cardiac axis describes the overall direction of electrical spread within the heart. In a healthy individual, the axis should spread from 11 o’clock to 5 o’clock. To determine the cardiac axis, one must look at leads I, II, and III.
- Normal cardiac axis: Lead II has the most positive deflection compared to leads I and III.
- Right axis deviation (RAD): Lead III has the most positive deflection, and lead I should be negative (as seen in right ventricular hypertrophy).
- Left axis deviation (LAD): Lead I has the most positive deflection, while Leads II and III are negative (typically seen in heart conduction abnormalities).
CONDUCTION DISORDERS
Prolonged PR interval suggests the presence of atrioventricular delay or AV block. By studying the waves and the PR interval, one can diagnose the type of conduction deficit (heart block):
First-degree heart block involves a fixed prolonged PR interval (>200 ms). It occurs between the SA and AV node in the atrium.
Second-degree AV block type 1 (also known as Mobitz type 1 AV block or Wenckebach phenomenon) occurs at the AV node and presents as progressive prolongation of the PR interval until eventually the atrial impulse is not conducted and the QRS complex is dropped. AV nodal conduction resumes with the next beat, and the sequence of progressive PR interval prolongation and the eventual dropping of a QRS complex repeats itself.
Second-degree AV block type 2 (Mobitz type 2 AV block), occurs after the AV node, and presents as a consistent PR interval duration with intermittently dropped QRS complexes due to a failure of conduction. The intermittent dropping of the QRS complexes typically follows a repeating cycle of every 3rd (3:1 block) or 4th (4:1 block) P wave.
Third-degree (complete) AV block occurs when there is no electrical communication between the atria and ventricles due to a complete failure of conduction, presenting as P waves and QRS complexes that have no association with each other, due to the atria and ventricles functioning independently. Cardiac function is maintained by a junctional or ventricular pacemaker.
Shortened PR interval may be due to the P wave originating somewhere closer to the AV node, so the conduction takes less time (size of atria and position of SA node can vary in some people). A short PR interval can also occur due to the atrial impulse going to the ventricle by a faster shortcut instead of conducting slowly across the atrial wall.
Delta wave is a slur or notch in the upstroke of the QRS complex that occurs when an accessory pathway is causing a shortcut faster conduction, and a shorter PR interval.
Absent P waves with an irregular rhythm may suggest a diagnosis of atrial fibrillation.
Narrow QRS complex (< 0.12 seconds) occurs when the impulse is conducted down the bundle of His and the Purkinje fiber to the ventricles. This results in well-organized and synchronized ventricular depolarisation.
Broad QRS complex (>0.12 seconds) occurs if there is an abnormal depolarisation sequence due to a ventricular ectopic (electrical focus point) from where the impulse spreads slowly across the heart muscle from the focus in the ventricle, or when there is a bundle branch block when the impulse gets to one ventricle rapidly and then spreads slowly across the other ventricle.
There are two types of bundle branch blocks: left bundle branch block (LBBB) and right bundle branch block (RBBB).
- LBBB: deep S wave in V1 which may be notched (“W”) and broad “M” shaped R wave in V6
- RBBB: RSR’ pattern in V1 (“M”) and broad S wave in V6 (“W”)
CARDIAC DISEASES
Pathological Q wave is > 25% the size of the R wave that follows it, or > 2mm in height and > 40ms in width. A single Q wave is not a cause for concern but Q waves in an entire territory (e.g. front leads or lower lead) can be evidence of previous myocardial infarction (MI – heart attack).
R and S waves progression is observed across the chest leads (from small in V1 to large in V6). The transition from S > R wave to R > S wave should occur in V3 or V4. Poor progression (i.e. S > R continuing through to leads V5 and V6) can be a sign of previous MI, but often occurs normally in many people due to poor lead position.
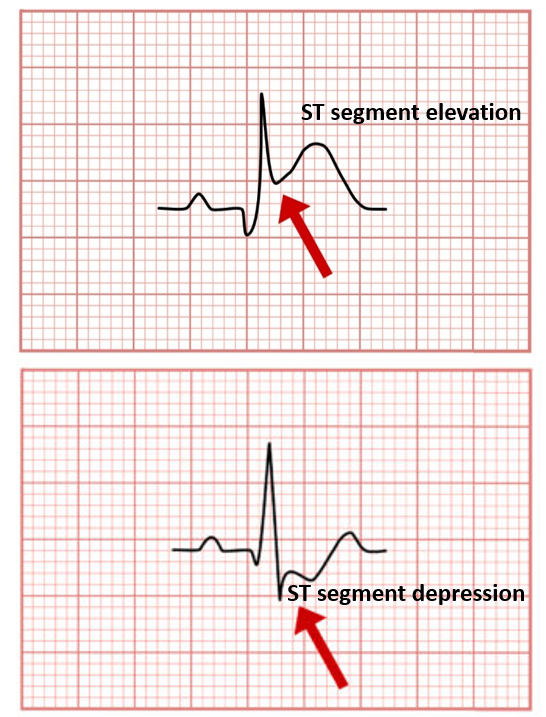
ST segment is the part of the ECG between the end of the S wave and the start of the T wave. In a healthy individual, it should be an isoelectric line (neither elevated nor depressed).
ST elevation is significant when it is greater than 1 mm (1 small square) in 2 or more contiguous limb leads or >2mm in 2 or more chest leads. It is most commonly caused by acute myocardial infarction, especially in those> 50 years. Sometimes onset of benign early repolarization (BER) especially in young people <50 years may cause ST elevation which is normal. There are 3 ways to differentiate:
- Features like raised J point, and raised T wave with ST elevation, make diagnosis of BER more likely.
- In MI, the ST elevation will be in particular leads, whereas in BER, it will be seen across multiple leads.
- In MI the ST elevation and other signs change and evolve over time, whereas in BER, they remain the same.
ST depression ≥ 0.5 mm in ≥ 2 contiguous leads indicates myocardial ischemia (reduced blood flow to the heart (Coronary Artery Disease).


Tall T waves are considered if they are > 5mm in the limb leads, and > 10mm in the chest leads. Tall T waves can be associated with hyperkalemia (increased blood potassium levels typically show as tall tented T waves) and also MI.
Inverted T waves are normally seen in V1, and sometimes in lead III. Inverted T waves in other leads are a nonspecific sign of a wide variety of conditions:
- Ischaemia (reduced blood flow/oxygen supply to heart)
- Bundle branch blocks (V4-6 in LBBB and V1-V3 in RBBB)
- Pulmonary embolism
- Left ventricular hypertrophy (in the lateral leads)
- Hypertrophic cardiomyopathy (advanced cases)
- General illness
Biphasic T waves have two peaks and can indicate ischaemia and hypokalaemia (low blood potassium).
Flattened T waves are a non-specific sign that may represent ischaemia or electrolyte imbalance.
U wave is very uncommon and is a > 0.5mm deflection after the T wave best seen in V2 or V3. These become larger the slower the heart rate (bradycardia). Classically U waves are seen in various electrolyte imbalances, hypothermia and secondary to medicines given for arrhythmia (such as digoxin, procainamide, or amiodarone).
Note: The ECG should be interpreted by a qualified medical practitioner and be correlated clinically with examination, history and other lab-test findings. These days often ECG interpretations are done by artificial intelligence, but that can sometimes lead to errors resulting in missing a diagnosis, or an incorrect diagnosis that can affect the patient. Therefore every computerized ECG report should always be cross-checked by a physician and then released to the patient.
Also read:
Cardiovascular Disease (CVD) – Understanding Atherosclerosis and Coronary Artery Disease


